Categories
Administration

How to downgrade Elasticsearch 7 to 6

If you have not reindexed your indices to version 7 (and your index was not from version 5 and below) then you can downgrade to version 6, most probably without data loss. Elasticsearch does not support downgrading as a feature. So in order to “downgrade” from version 7 to version 6 you will need to uninstall version 7 and reinstall version 6. On Ubuntu this can look like the following:

sudo service elasticsearch stop
sudo apt-get remove elasticsearch
wget -qO - https://artifacts.elastic.co/GPG-KEY-elasticsearch | sudo apt-key add -
sudo apt-get install apt-transport-https
echo "deb https://artifacts.elastic.co/packages/6.x/apt stable main" | sudo tee -a /etc/apt/sources.list.d/elastic-6.x.list
sudo apt-get update && sudo apt-get install elasticsearch

If you are running Elasticsearch on AWS then you will need to:

  1. Create a manual snapshot of your version 7
  2. Restore the snapshot to version 6

I have not tried the above on AWS but for more information please check the links below:

https://docs.aws.amazon.com/elasticsearch-service/latest/developerguide/es-managedomains-snapshots.html https://www.amazonaws.cn/en/elasticsearch-service/faqs/

Breaking Changes

Elasticsearch 7 can only read indices created from version 6 onwards, so your indices from 5 and below will not work anymore. There are restrictions add to the index names as well for example column symbol i.e : is not allowed in the index name anymore. The list of breaking changes are significant and you should make it a must to read the whole list before upgrading: https://www.elastic.co/guide/en/elasticsearch/reference/current/breaking-changes-7.0.html

The key lesson to take here is that major versions contain breaking changes and might not be backward compatible. And that you should first upgrade to a staging server and make sure that all your tests pass before upgrading to production.

Categories
Uncategorized

How to enable aim assist in Apex Legends PS4

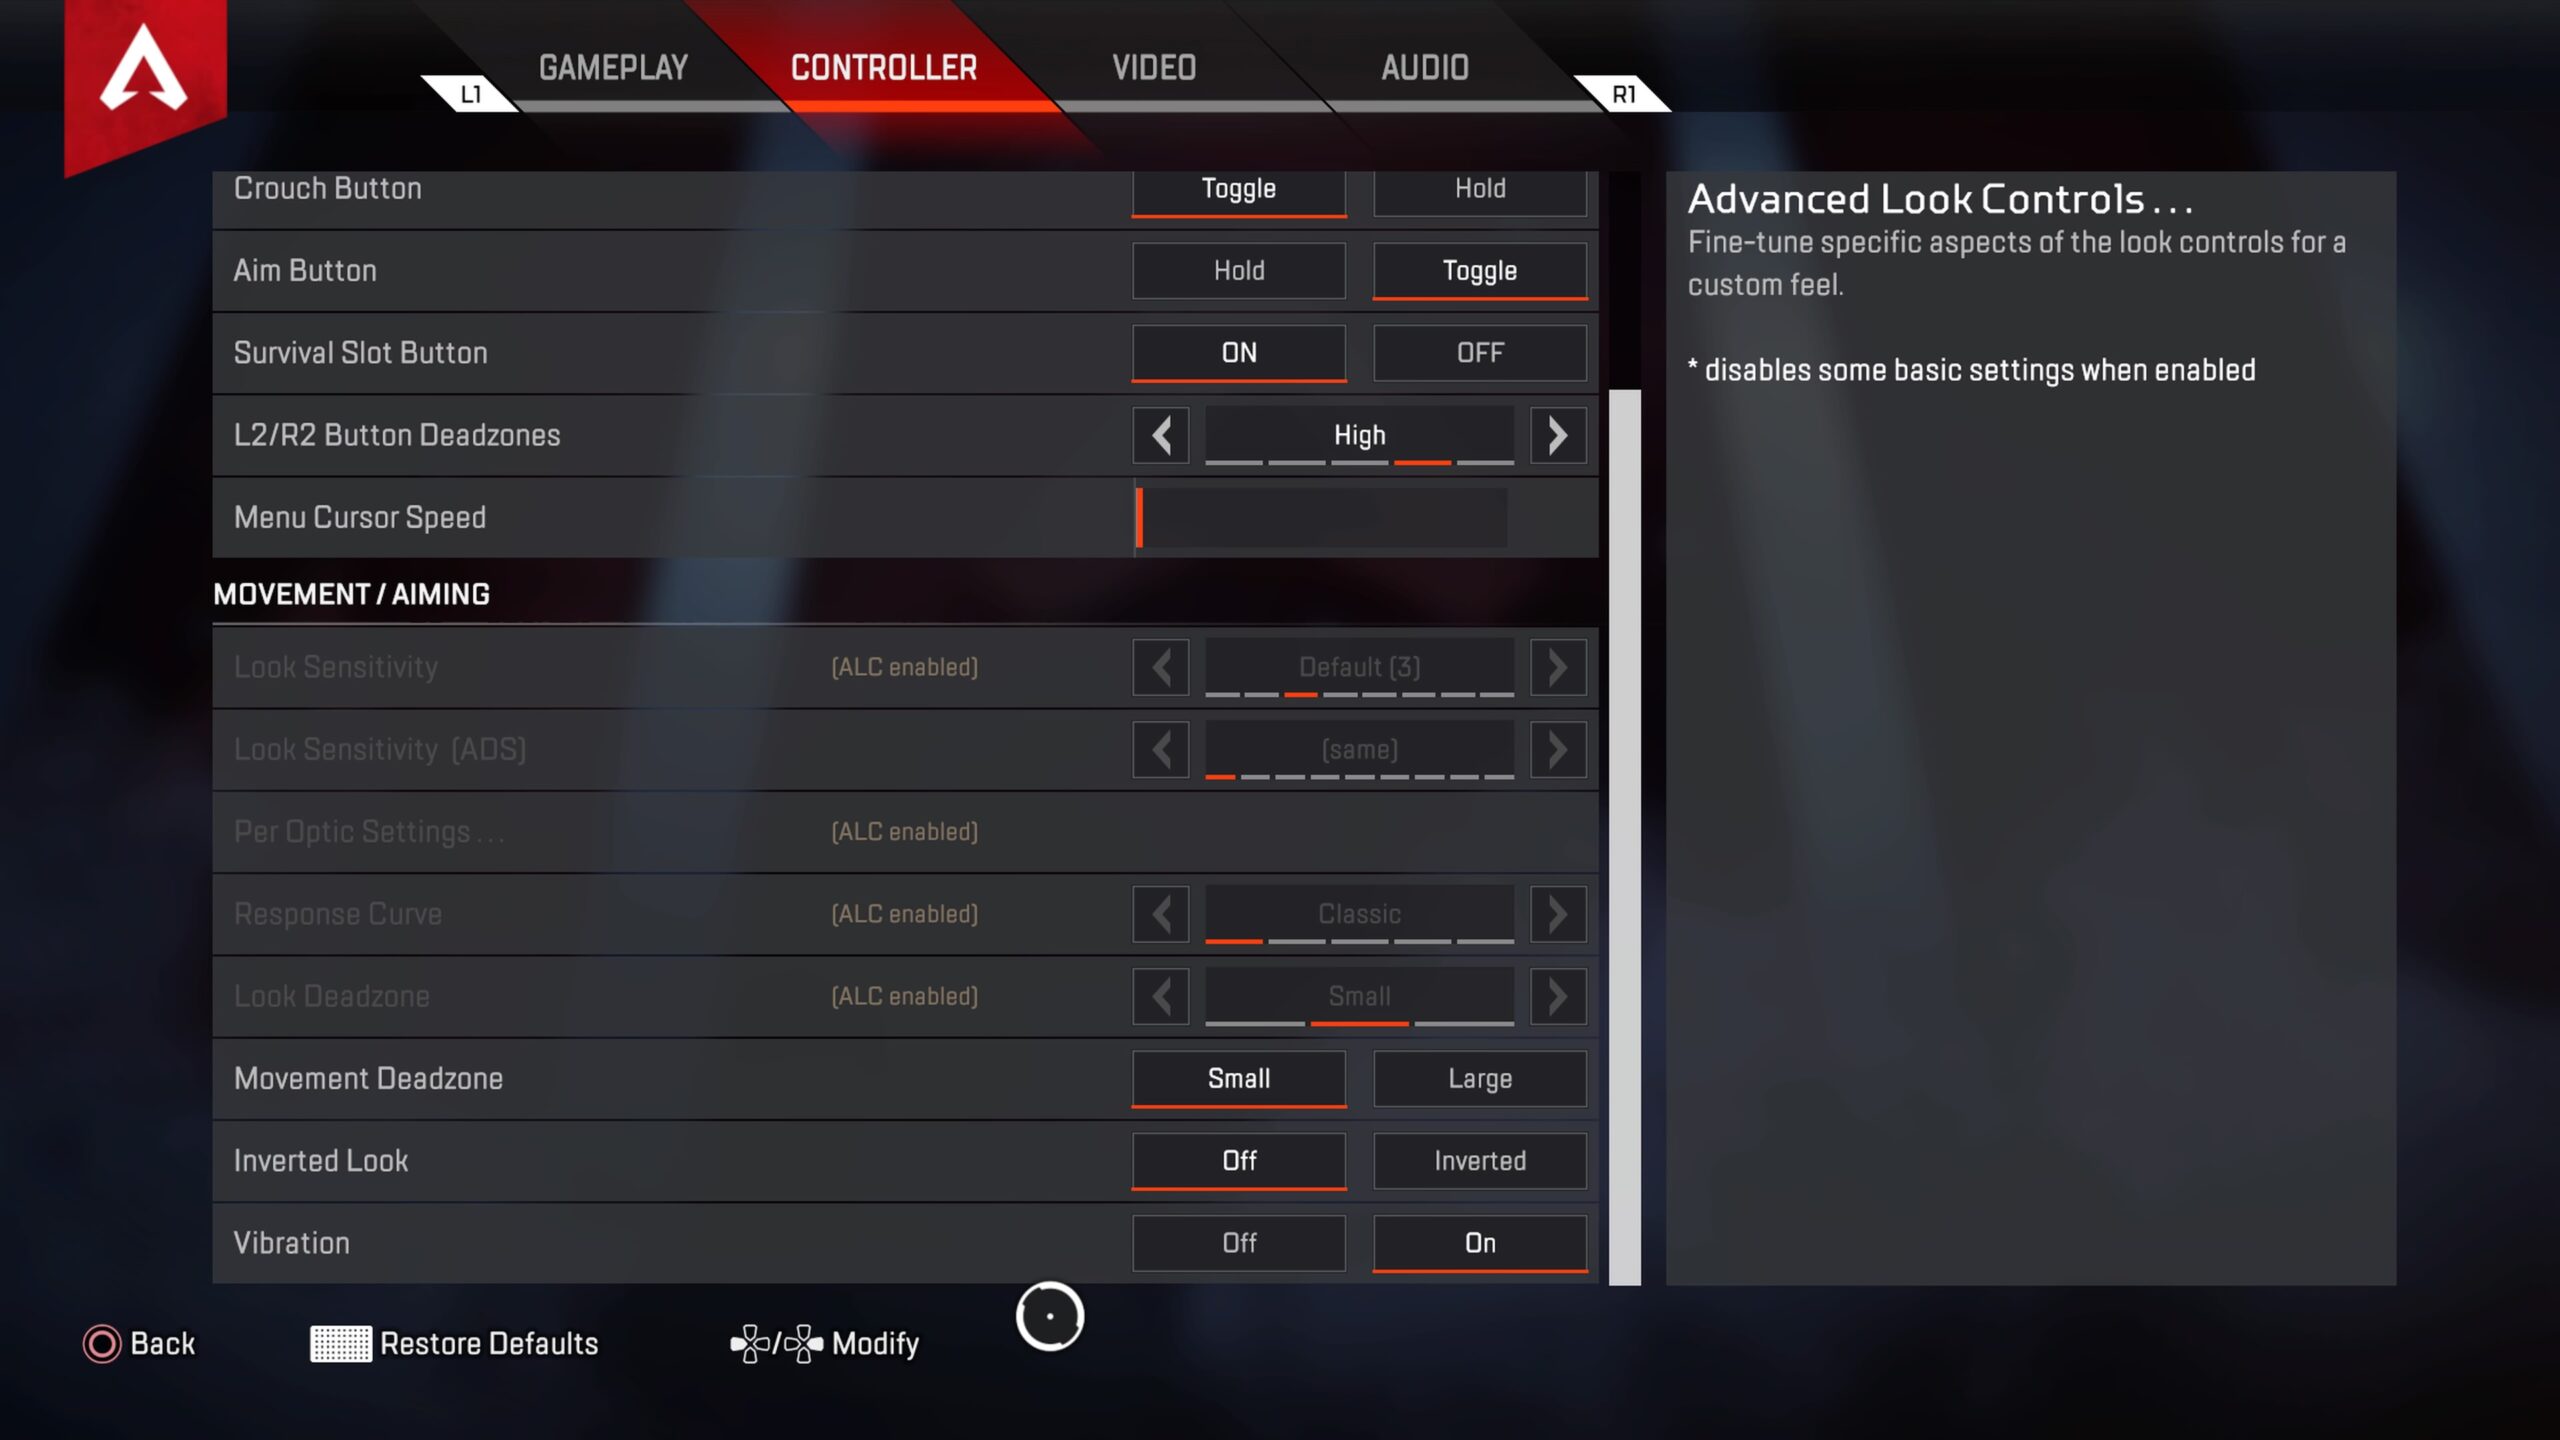
Turns out the option is hidden. You need to go into settings and then controller. Once in the controller tab you need to scroll down completely and then click next to the modify button. Yes! in the black space!! Find screenshot below. Move your cursor in the same position as mine and then tap X.

Switch “Custom Look Controls” to On. Now you can adjust your aim assist settings!

Update: As from Season 9 you should see the Advanced Look Controls… button!

If this was helpful you can also check how to enable bots in firing range at: https://everythingtech.dev/2021/07/how-to-enable-bots-in-firing-range-in-apex-legends/ The perfect way to warm up!

You would also be interested in the best aim assist settings at https://everythingtech.dev/2021/07/best-apex-legends-aim-assist-settings/

Categories
Administration

WordPress Speed Optimisation

This article covers ways to improve speed of execution for WordPress but you could also look at it as a checklist to verify. Speed of a website is crucial to retain viewers. It is said that 47% of the viewers expect websites to load within 2 seconds, but don’t quote me from that this is just a figure from https://www.crazyegg.com/blog/speed-up-your-website/

Shared Managed Hosting

First question to ask is whether you are on shared hosting? If you are a shared hosting that means a few things. The machine on which you are running is shared with other users, just like the name suggests. So in case they exceed the normal X amounts of visits, for example 20,000 per month. And get a spike in traffic this could mean that your website experiences a slow down. This is because the resources are being used by the other user’s website. Of course this depends and might not happen.

Dedicated Managed Hosting

If you have the money available and you are experiencing significant traffic consider to invest in a dedicated hosting option. The other advantage is that this is also more secure. The other downside from shared hosting is that if a website from a user sharing the machine has been attacked by a malware. Then you could also be a victim of it. So the first advice if you can afford it is to buy the dedicated hosting solution.

Use A CDN

If you don’t have it yet on your managed hosting then try to at least configure your DNS records on Cloudflare for example. Cloudflare will provide you with a few speed improvements out of the box for free which is the autominification of css, html and javascript. There are other CDNs available and well documented here: https://www.wpbeginner.com/showcase/best-wordpress-cdn-services/

Image Optimisation

The next speed optimisation is to compress your images (and to serve them over a CDN actually). You can do the first part easily with a plugin. Many of them are available again well documented on WPBeginner https://www.wpbeginner.com/plugins/best-wordpress-image-compression-plugins-compared/

Offload Images

On top of compression you as far as possible you try to offload the images completely from your website. They easily the largest files that are going to be served by your pages. You can do this with the plugin: https://wordpress.org/plugins/amazon-s3-and-cloudfront/

Use PHP 7

If you are on Godaddy hosting for example you should make sure to check on your Godaddy dashboard that you are using the latest version of PHP7. PHP7 is nearly 2 times faster than Php5. However, before making any changes to the PHP5 please do it in a test environment/staging server first. It might be that not all your plugins have been coded to support PHP7.

Use Opcache

Opcache uses a byte caching engine to save operations in memory. In short it will make your processing faster at the expense of memory. You should again conduct your tests in a staging environment. You need to make sure that you have the opcache extension and to enable it in your php.ini(opcache.enable=1) or your dashboard (if from a managed hosting). If you have access to the server then you are in luck, because although enabling is easier, tuning OpCache is much harder.

But there is a handy script available which does that https://gist.github.com/ck-on/4959032

For example if you run it and find the following you will know that all the opcache memory allocated is being used so you might consider increasing it.

Object Caching

Just like you offloaded images before you should also consider offloading memory. This can be done by installing a database like Redis and then using the following plugin https://wordpress.org/plugins/redis-cache/ to cache objects there. Careful to benchmark your system again or at least use monitoring to see if there is an actual improvement in performance from this.

Query Monitor

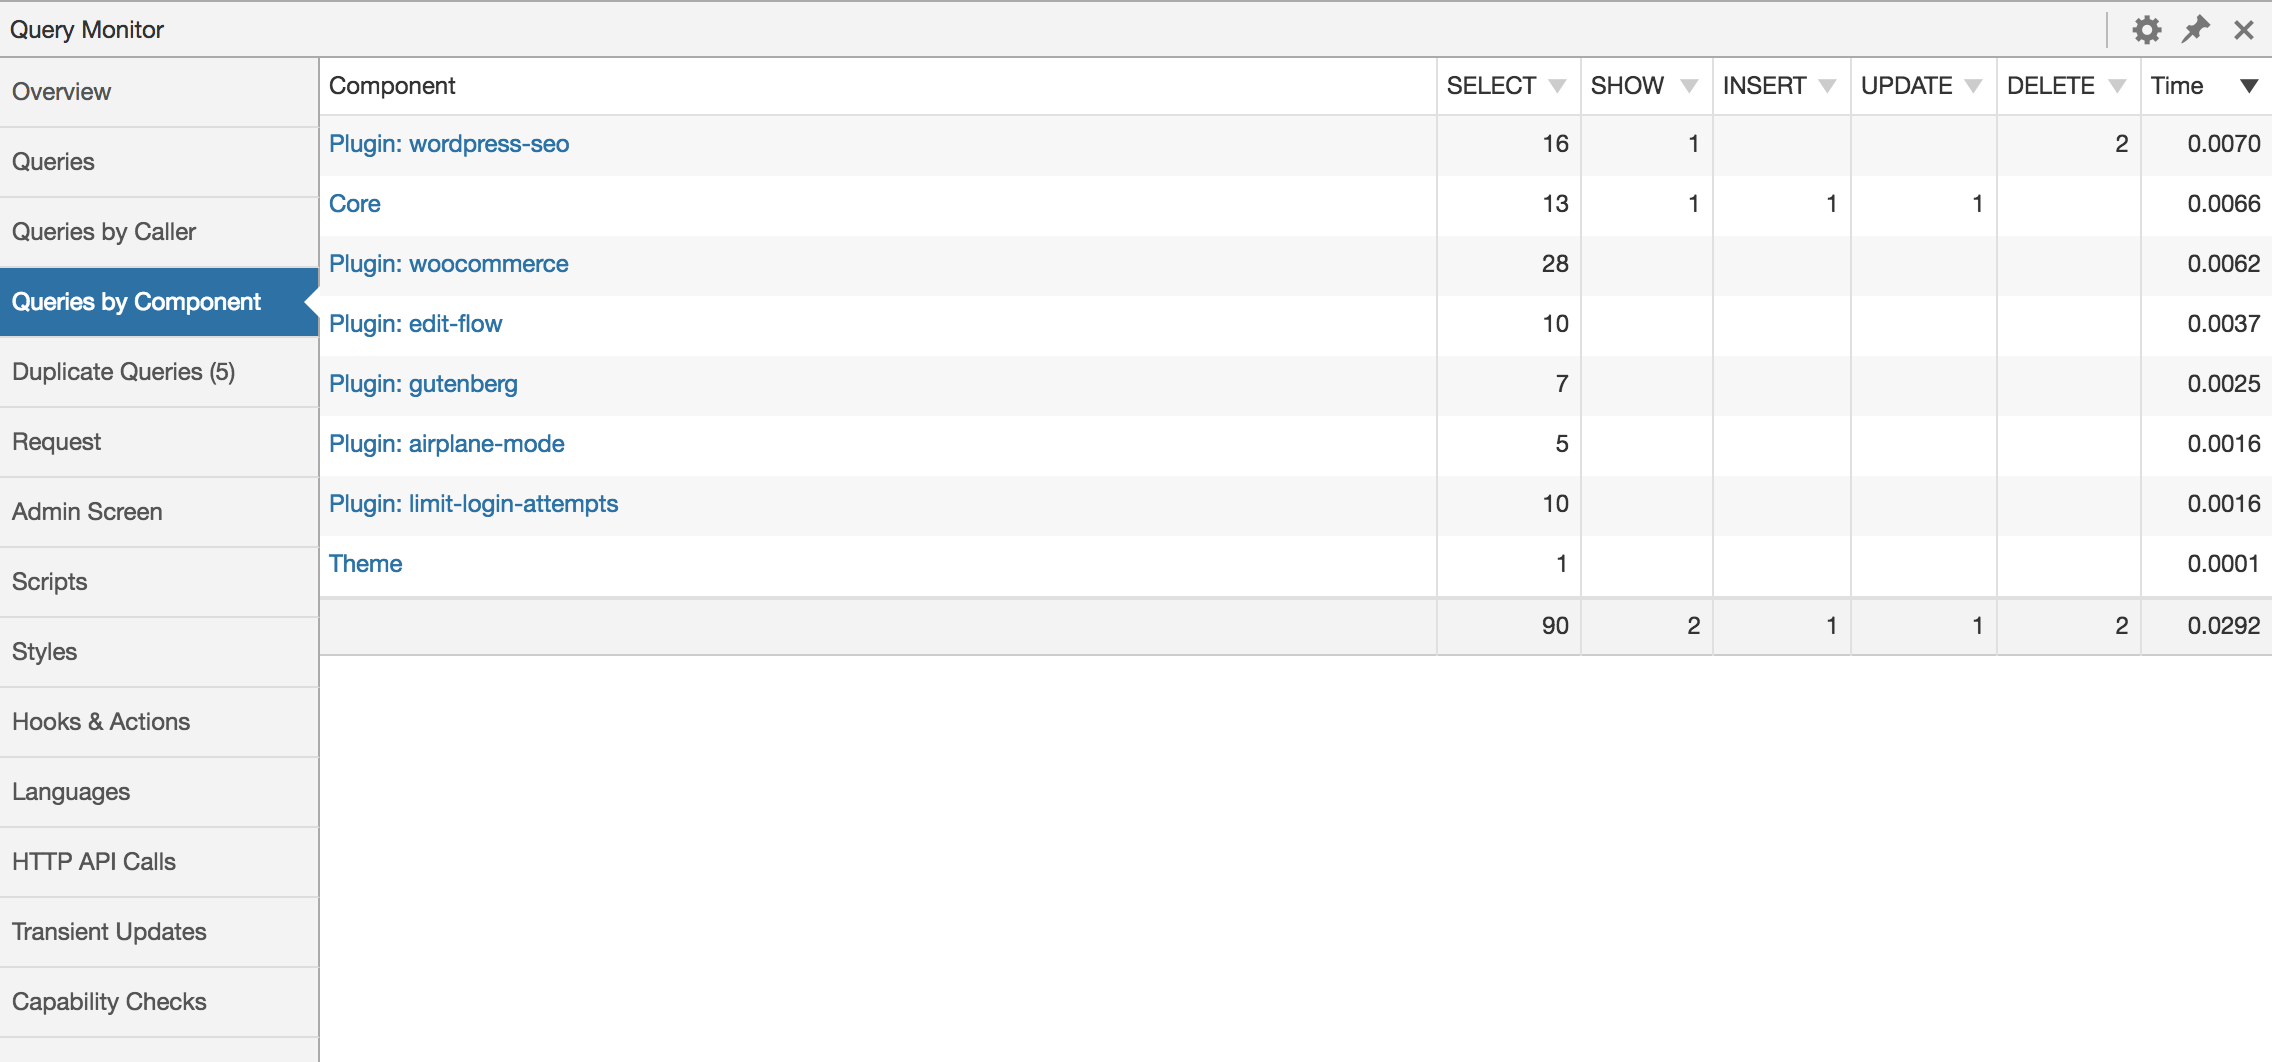
This one is a free plugin you can download here https://wordpress.org/plugins/query-monitor/ which will basically allow you to find which queries are taking more time and also to allow you to check if there are any improvements from adjusting Opcache and object caching. Additionally, you could also pinpoint part of the code that is slow(and potentially identify plugins making your website slow).

Query monitor showing time taken by plugins

MySQL Tuner

If you have access to the installation of the MySQL server on which the WordPress site is running you could actually use the script here https://github.com/major/MySQLTuner-perl to get tips on how to adjust the configuration to get better performance.

IO Limit

A lot of people who run WordPress on AWS are unaware of the limitations present gp2 volume types. The IO limit is based on the size of the disk that you are using. You won’t feel this until you have expended your burst credit https://aws.amazon.com/blogs/database/understanding-burst-vs-baseline-performance-with-amazon-rds-and-gp2/ If you are experiencing a slow website you should consider monitoring that either with iostats command or cloud monitoring(if available). Same thing for other volumes outside AWS.

Tuning Apache

If you have access to apache2 then you should consider tuning this as well. You can use https://github.com/richardforth/apache2buddy apache2buddy which is the equivalent of MySQL tuner but for apache2. Things to take in consideration are the sessions sizes and how long they should last. It doesn’t make sense if you have a small blog to allocate too much to both of them. Anyway Apache2buddy will make a best guess for you.

If you have any other ways to optimise please feel to comment.

Categories
Administration Development

How to convert your WordPress blog to a PWA in 2 minutes

What is a PWA?

In layman language what this means is that when a user goes onto your WordPress website from a mobile phone, they get an option to add it to their home screen. Then they can just click on the icon to view your website. Connect to the internet and automatically get new blog posts! Visit from the Desktop browser and get to save it to the browser’s apps!

PWA Plugin

There are a number of PWA plugins available on the WordPress free plugin repository but the one that I can recommend is the one that I am using for this blog is the free version of https://superpwa.com/ from https://wordpress.org/plugins/super-progressive-web-apps/

You can install it like any other WordPress plugin. There is one requirement though, you need to have HTTPS enabled on your website and the certificate cannot be a letsencrypt certificate. This means that you will probably have to invest around 5$ into that.

Configuration

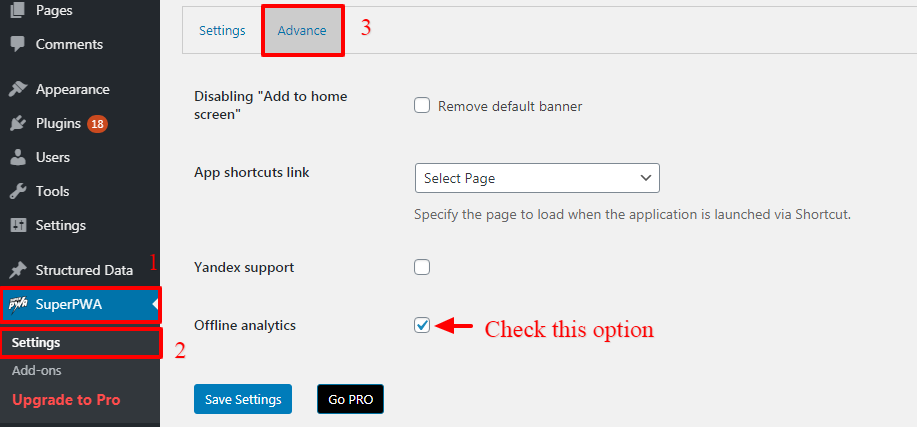
You can find the settings under the SuperPWA tab. You can configure splash screens, icons and starting page from the dashboard but the best feature is probably the ease with which you can enabled offline analytics. To do that just go into advance and check the offline analytics box.

pwaconfig

If you want more features you could buy the Pro package or you could implement it yourself, the source is available here: https://github.com/SuperPWA/Super-Progressive-Web-Apps

How to check if it is working?

  1. You can check by visiting the website on your phone. You should see a dialog box at the bottom asking you to add the page to your home screen. For example:
Taken from: https://superpwa.com/

2. You might be having trouble to test if you are on an iphone. So an alternative is to use Google Chrome Dev Tools on your machine. It will tell you in the last tab if it is a PWA progressive web app. Find out more here: https://developers.google.com/web/tools/lighthouse#devtools

Final Words

If you are really want iOS users to be able to save your app on their phone. Then you should add a tab in your blog to explain to them how to manually add it to the home page from Safari. Hope that this short post was useful!

Categories
Ideas

How much internet does mining on PI Network use?

Quick Answer: Around 45 KB per day of data usage/internet in background.

PI Network

Pi Network (PI) cryptocurrency is the first coin that can be mined through your mobile phone. It was launched on March 14, 2019, as a beta version by Stanford graduates, Dr Nicolas Kokkalis, Dr Chengdiao Fan, Aurelien Schiltz, and Vincent McPhillips. Since its inception, March 14 has been marked as PI day.

Their mode of approach was through building an app capable enough to gain users with interests in joining a new social network while mining cryptocurrency. 

Explaining The Mining of Cryptocurrency

Mining of cryptocurrencies like Bitcoin is increasingly hard and at this point you will spend more money on electricity than the reward of selling a Bitcoin if you find one. Contrary to usual cryptocurrencies with PI you can mine on your mobile phone. This is possible because it uses the Stellar Consensus Protocol in background.

Mining PI For Users

To mine Pi, all you have to do is install the PI app on your smartphone. The app connects to the node(s) and checks if transactions have been recorded on the ledger. The app connects to multiple nodes to cross-check this information. In Pi once a day everyone who contributed get a meritocratic distribution of new Pi by just being in the network. But this means that you have to be connected to the internet in order to mine Pi.

How much internet does it use?

So after mining Pi for a month every day without missing any days and staying connected for 24/7. My mobile phone has logged that the Pi app has used only 1.07 mb from Feb 28 to March 24, which is roughly 24 days. Making the total usage per day to 45 KB which really negligible in my opinion! So what are you waiting for? Mine away! https://minepi.com/

Categories
Administration Development

Three Ways To Shallow Clone In Git

A shallow clone is a git clone of only part of a repository’s git commit history. There are three ways that we found that this can be done. This can be useful in situations where you need to download only part of the files in a large git repository. As a bonus we also cover how to fetch a single commit and partial clones.

If you want to improve the overall speed of git commands then we suggest you upgrade to the latest versions which have significant improvements done to the commit-graph.

Three ways To Shallow Clone

The only prerequisite is that you have at least git version 1.9 and the command is basically as follows:

git clone <repository> --depth 1

This will download only the latest commits instead of the entire repository. This should make things considerably faster. If you are using a newer version of git 2.11.1 you can also use shallow-exclude with a remote branch or tag.

git clone <repository> --shallow-exclude=<remote branch or tag>

Or

git clone <repository> --shallow-since=YYYY-MM-DD

Bonus: Fetch A Single Commit

As from git version 2.5 you are allowed to fetch a single commit. git-upload-pack which is typically not used by the user but runs as part of git fetch. You can use git clone to get a shallow clone in combination with git-upload-pack and the SHA1 of a commit to fetch a single commit. Let’s say for example we want to fetch only this commit from Apache Flink https://github.com/apache/flink/commit/c0cf91ce6fbe55f9f1df1fb1626a50e79cb9fc50

git clone --depth=1 https://github.com/apache/flink.git c0cf91ce6fbe55f9f1df1fb1626a50e79cb9fc50

If you compare with a full clone we downloaded only 22005 instead of 89581.

Categories
Development

Python Logging To CSV With Log Rotation and CSV Headers

For those who are short on time please find a minimal snippet for correctly logging to CSV with Python3.8:

*READ BELOW TO SEE HOW WE ADD A HEADER AND DO LOG ROTATION

import logging
import csv
import io
class CSVFormatter(logging.Formatter):
	def __init__(self):
		super().__init__()
	def format(self, record):
		stringIO = io.StringIO()
		writer = csv.writer(stringIO, quoting=csv.QUOTE_ALL)
		writer.writerow(record.msg)
		record.msg = stringIO.getvalue().strip()
		return super().format(record)

logger = logging.getLogger(__name__)
logger.setLevel(logging.DEBUG)
# loggingStreamHandler = logging.StreamHandler()
loggingStreamHandler = logging.FileHandler("test.csv",mode='a') #to save to file
loggingStreamHandler.setFormatter(CSVFormatter())
logger.addHandler(loggingStreamHandler)
logger.info(["ABDCD", "EFGHI"])
#READ BELOW TO SEE HOW WE ADD A HEADER AND DO LOG ROTATION

Let’s explain some of the above code further, the implications and then let’s also see how to incorporate writing a header. Parts about the logger, log levels and the formatter are explained in the previous post, feel free to catchup quickly if you would like: https://everythingtech.dev/2021/03/python-logging-with-json-formatter/

CSV Formatter

Just like we did for the JSON Formatter, we are extending the logging Formatter class to modify the override the format method. We are using the CSV and the IO Library here also means that this has a few performance implications. If performance is critical for you and/or logging forms a significant part of your system then I would recommend that you benchmark your system before and after adding the CSV logging part.

Anyway, moving on, we are calling csv.writer which needs a destination to write the CSV lines and quoting settings. In this case we have provided a buffered stream of bytes of character and numbers, a StringIO object from the IO library. We do this because we are already saving the log to disk with our FileHandler.

Adding CSV Header & Rotating Logs

Adding a CSV Header is trickier than it looks, specially because we are looking to add log rotation. This means that we have write a header before a log is created and just after it is rolled over. Turns out that TimedRotatingFileHandler deletes the stream it is writing to just before rolling over and the stream is not accessible before the initialisation. There are 2 options to bypass this that I thought about (may be there is a better one? If you know it please comment below):
Option 1: Rewrite the constructor of TimedRotatingFileHandler. But this also means that any breaking change in the library could prevent our application to stop working.
Option 2: Check the file size before writing to the log and if it is empty write the header. This is expensive though because we basically have an additional operation before every write (emit function). In this post, until I find a better way we used this method.

import logging
from logging import handlers
import csv
import io
import time
import os
from datetime import datetime

class CSVFormatter(logging.Formatter):
	def __init__(self):
		super().__init__()
	def format(self, record):
		stringIO = io.StringIO()
		writer = csv.writer(stringIO, quoting=csv.QUOTE_ALL)
		writer.writerow(record.msg)
		record.msg = stringIO.getvalue().strip()
		return super().format(record)

class CouldNotBeReady(Exception):
	pass

class CSVTimedRotatingFileHandler(handlers.TimedRotatingFileHandler):
	def __init__(self, filename, when='D', interval=1, backupCount=0,
                 encoding=None, delay=False, utc=False, atTime=None,
                 errors=None, retryLimit=5, retryInterval=0.5,header="NO HEADER SPECIFIED"):
		self.RETRY_LIMIT = retryLimit
		self._header = header
		self._retryLimit = retryLimit
		self._retryInterval = retryInterval
		self._hasHeader = False
		super().__init__(filename, when, interval, backupCount, encoding, delay, utc, atTime)
		if os.path.getsize(self.baseFilename) == 0:
			writer = csv.writer(self.stream, quoting=csv.QUOTE_ALL)
			writer.writerow(self._header)
		self._hasHeader = True

	def doRollover(self):
		self._hasHeader = False
		self._retryLimit = self.RETRY_LIMIT
		super().doRollover()
		writer = csv.writer(self.stream, quoting=csv.QUOTE_ALL)
		writer.writerow(self._header)
		self._hasHeader = True

	def emit(self, record):
		while self._hasHeader == False:
			if self._retryLimit == 0:
				raise CouldNotBeReady
			time.sleep(self._retryInterval)
			self._retryLimit -= 1
			pass
		super().emit(record)

logger = logging.getLogger(__name__)
logger.setLevel(logging.DEBUG)
loggingStreamHandler = CSVTimedRotatingFileHandler(filename="log.csv", header=["time","number"]) #to save to file
loggingStreamHandler.setFormatter(CSVFormatter())
logger.addHandler(loggingStreamHandler)
import random
while True:
	today = str(datetime.now().strftime("%m/%d/%Y, %H:%M:%S"))
	logger.info([today,random.randint(10,100)])
	time.sleep(1)

So the first part of the code is quite straightforward, we are extending the TimedRotatingFileHandler class. You will notice other useful parameters like When and Interval. These 2 are important will determine when your logs will rotate. The following are possible parameters for When taken from original code.

# Calculate the real rollover interval, which is just the number of
# seconds between rollovers.  Also set the filename suffix used when
# a rollover occurs.  Current 'when' events supported:
# S - Seconds
# M - Minutes
# H - Hours
# D - Days
# midnight - roll over at midnight
# W{0-6} - roll over on a certain day; 0 - Monday
# Case of the 'when' specifier is not important; lower or upper case
# will work.

We have added additional constructor parameters like the Header, retryCount and retryInterval. The Header is to make sure you can specify header a CSV Header. The retryCount and retryInterval have been added to make sure that the Header is written first in the log files. Logs are written asynchronously and if you take a look at the emit code we have to make sure that the Header is written first before any logs are written.

Of course, we do not want to be stuck indefinitely in a loop. At every retryInterval a check is performed to make sure we have written the header and this is retried a default number of 5 times before it raises a dummy exception that we created. You can then handle it as you would like but it should work fine.

This has to be repeated every time we are rolling over as well that is why we assigned a constant at first to restore the retry to its current value. The way we are writing the header is to use the stream created by the logger directly and calling the csv library to write to that stream. The other csv options also has to be provided for your header. You can add additional parameter to the constructor to do that.

Disclaimer

This has not been tested in production, has to be used for learning purposes only and I recommend that you either use a third party library or adapt the code to your situation. For example, create a better exception that you can handle when the logs are in the wrong order(if you modify the code). Anyway I hope this has saved you time and feel free to comment if you want to achieve anything else and you are stuck. Thanks for reading! 🙂

If you would like to learn more Python check out this certificate course by Google: IT Automation with Python

Categories
Development

Python logging json formatter

Disclaimer: This tutorial has been tested on Python3.8.

If you are short on time please find below the minimal required code to turn log messages into correct JSON format in Python using the builtin logging module:

import logging
import json
class JSONFormatter(logging.Formatter):
	def __init__(self):
		super().__init__()
	def format(self, record):
		record.msg = json.dumps(record.msg)
		return super().format(record)
logger = logging.getLogger(__name__)
logger.setLevel(logging.DEBUG)
loggingStreamHandler = logging.StreamHandler()
# loggingStreamHandler = logging.FileHandler("test.json",mode='a') #to save to file
loggingStreamHandler.setFormatter(JSONFormatter())
logger.addHandler(loggingStreamHandler)
logger.info({"data":123})

Getting A Logger Object

If you are still reading I am going to assume that you are interested in learning about how the above works. First of all we creating a logger object with logger = logging.getLogger(__name__). If you are not familiar with the special variable __name__, this change depending on where you are running the script. For example if you are running the above script above directly the value will be “__main__”. However, if this is being run from a module then it will take the module’s name.

Setting The Log Level

You can set different log levels to the logger object. There are 5 log levels in the following Hierarchy:

  1. DEBUG
  2. INFO
  3. WARNING
  4. ERROR
  5. CRITICAL

It is a hierarchy because if you set the log level let’s say at INFO, then INFO, WARNING, ERROR and CRITICAL only work i.e DEBUG messages are ignored. If you are accessing a logger and you are not sure which log levels it can log you can always call logger.isEnabledFor(logging.INFO) to check if a particular level is enabled (of course replace logging.INFO with any other level that you want to check).

Anyway we set the log level to DEBUG in this example: logger.setLevel(logging.DEBUG)

Handlers

Handlers are used to serve messages to destinations. In this case, the StreamHandler is used to send messages (like you guessed) to streams. This includes the console. there are 14 handlers which come inbuilt you can find more information on them here: https://docs.python.org/3/howto/logging.html#useful-handlers

As an alternative you can change the handler to a FileHandler to save to disk.

Formatter

In the code above we create a class JSONFormatter which inherits from class logging.Formatter. Then we override the format function of the class to write our own format class. Here, we have made use of the json library to make sure we are converting dictionaries correctly to json. Feel free to use any other formatting that you like. The message passed in .info here is stored record.msg. If you would like to find all the attributes that are stored in record you can call record.__dict__ You should something like the following:

{'name': 'context_name', 'msg': '{"data": 123}', 'args': (), 'levelname': 'INFO', 'levelno': 20, 'pathname': 'minimal.py', 'filename': 'filename.py', 'module': 'minimal', 'exc_info': None, 'exc_text': None, 'stack_info': None, 'lineno': 16, 'funcName': '<module>', 'created': 1615752571.359734, 'msecs': 359.73405838012695, 'relativeCreated': 14.586210250854492, 'thread': 140735484547968, 'threadName': 'MainThread', 'processName': 'MainProcess', 'process': 6774}

This gives you a few useful information that you can make use of based on your needs. In this case we have only used msg.

There is a bit more to this than what I have covered and I would recommend you to check out the official documentation and inspect the code of the module. You could also comment below if you would like to see any other logging article.

Thanks for reading!

Categories
Security

Basic Honeypot: Analysing Payload/Attacks

This is a followup to building a basic honeypot. In this post we analysing attacks that we have collected over one week, eh wait actually over only one day. It so happens that there were around 100,000 payload attack collected in one day and I think this is enough data for now to analyse (manually).

Note that the payloads below are only the first payload sent before the attacks actually begin. Also there were many attacks to discover open ports which I have ignored/not worth documenting.

Microsoft Remote Desktop Vulnerability

The large majority of attacks (a whopping 75%) sustained by the honeypot were attacks to detect vulnerable Microsoft Remote Desktop servers. The payload was as follows:

b'\x03\x00\x00+&\xe0\x00\x00\x00\x00\x00Cookie: mstshash=hello\r\n\x01\x00\x08\x00\x03\x00\x00\x00'

The attacker uses this payload to detect if there are any compromised windows machines accessible. If you are interested you can find more information here: https://medium.com/@bromiley/what-happens-before-hello-ce9f29fa0cef

Windows Authentication Protocol Exploit

This one is likely a SMB Relay attack being conducted to eventually try to gain access to a windows machine by exploiting a design flaw(at that time). The payload looks like the following:

b'\x00\x00\x00T\xffSMBr\x00\x00\x00\x00\x18\x01(\x00\x00\x00\x00\x00\x00\x00\x00\x00\x00\x00\x00\x00\x00/K\x00\x00\xc5^\x001\x00\x02LANMAN1.0\x00\x02LM1.2X002\x00\x02NT LANMAN 1.0\x00\x02NT LM 0.12\x00'

You can read more into it here: https://resources.infosecinstitute.com/topic/exploiting-windows-authentication-protocols-part-01/

Find Accessible /.env files

This was a simple GET request to attempt to access .env file which is a configuration used by frameworks like Docker. This contains information like API keys or even passwords.

'GET /.env HTTP/1.1\r\nHost: 128.199.193.172\r\nUser-Agent: Mozlila/5.0 (Linux; Android 7.0; SM-G892A Bulid/NRD90M; wv) AppleWebKit/537.36 (KHTML, like Gecko) Version/4.0 Chrome/60.0.3112.107 Moblie Safari/537.36\r\nAccept-Encoding: gzip, deflate\r\nAccept: text/html,application/xhtml+xml,application/xml;q=0.9,image/webp,image/apng,*/*;q=0.8\r\nConnection: keep-alive\r\nCache-Control: max-age=0\r\nUpgrade-Insecure-Requests: 1\r\nAccept-Language: en-US,en;q=0.9,fr;q=0.8\r\n\r\n'

It has been reported before that botnets scan the internet to find accessible .env files to attempt attacks. I guess this is proved true here around 0.4% of the attacks were .env file discovery attacks. You can read more about it here: https://www.zdnet.com/article/botnets-have-been-silently-mass-scanning-the-internet-for-unsecured-env-files/

Android Debug Bridge Exploit

I am not sure about this but it looks like an attack to ADB and checking for shell access. Payload is as follows:

b'CNXN\x00\x00\x00\x01\x00\x00\x04\x00\x1b\x00\x00\x00M\n\x00\x00\xbc\xb1\xa7\xb1host::features=cmd,shell_v2'

No concrete reference to the payload above but the following shows the seriousness of the issue: https://labs.bitdefender.com/2018/09/hide-and-seek-iot-botnet-learns-new-tricks-uses-adb-over-internet-to-exploit-thousands-of-android-devices/

Exposed Apache Solr Admin Access

Simply an accessible admin page of Apache Solr. This should not be publicly accessible for obvious reasons.

'GET /solr/admin/info/system?wt=json HTTP/1.1\r\nHost: 128.199.193.172:8983\r\nUser-Agent: Mozilla/5.0 (Windows NT 10.0; Win64; x64) AppleWebKit/537.36 (KHTML, like Gecko) Chrome/78.0.3904.108 Safari/537.36\r\nAccept-Encoding: gzip\r\nConnection: close\r\n\r\n' from ('45.155.205.225', 55070)

CVE-2019-7238 RCE vulnerability in Sonatype Nexus Repository Manager

Based on the reference below this is a vulnerability present Sonatype Nexus Repository Manager installations prior to version 3.15.0. The payload attack is as follows:

'POST /service/extdirect HTTP/1.1\r\nHost: 128.199.193.172:8081\r\nUser-Agent: Mozilla/5.0 (Windows NT 10.0; Win64; x64) AppleWebKit/537.36 (KHTML, like Gecko) Chrome/78.0.3904.108 Safari/537.36\r\nContent-Length: 293\r\nContent-Type: application/json\r\nAccept-Encoding: gzip\r\nConnection: close\r\n\r\n{"action":"coreui_Component","data":[{"filter":[{"property":"repositoryName","value":"*"},{"property":"expression","value":"1==1"},{"property":"type","value":"jexl"}],"limit":50,"page":1,"sort":[{"direction":"ASC","property":"name"}],"start":0}],"method":"previewAssets","tid":18,"type":"rpc"}'

You can read more about it in this link: https://unit42.paloaltonetworks.com/hide-n-seek-botnet-updates-arsenal-with-exploits-against-nexus-repository-manager-thinkphp/

Vulnerable Ethereum Node

Although I am not sure if this attack was actually to find vulnerable Ethereum nodes, there are Ethereum nodes vulnerable to json-rpc attacks. The payload attack is as follows:

'POST / HTTP/1.0\r\nContent-Length: 51\r\nContent-Type: application/json\r\n\r\n{"id":0,"jsonrpc":"2.0","method":"eth_blockNumber"}'

As I go through the attacks collected I am realising that the list is too long and sadly won’t be able to go through all of them manually. In the coming days I will try to think of a better way to identify and categorise them.

Anyway I hope that this was informative and that this post has motivated you to take the necessary precautions. The web is a scary place!

Categories
Administration

How to Fix Git error: RPC failed; curl 55 OpenSSL SSL_write: SSL_ERROR_ZERO_RETURN, errno 10053

RPC failed; curl 55 OpenSSL SSL_write: SSL_ERROR_ZERO_RETURN, errno 10053. fatal: the remote end hung up unexpectedly

One of the reasons for this to happen is that you might have a large file inside your commit that is failing to be pushed eventually hanging with “fatal: the remote end hung up unexpectedly”.

If you can confirm that the issue is indeed with a large file then you should use git lfs but note that git lfs will intercept large files tracked and upload it on its own server:

  1. Install Git Large File Storage: https://git-lfs.github.com
  2. For example on MacOS:
brew install git-lfs

If that fails then:

brew install --build-from-source git-lfs
  1. git-lfs has a lot of dependencies( go, libyaml, [email protected], readline and ruby) so it might take a while to install. You can also install from binary by running the ./install.sh.
  2. Once installed you can track all large files for example in the docs:
git lfs track "*.psd"
  • Your tracked files’ details are saved inside a .gitattributes so make sure to add .gitattributes to persist tracking when other users clone the project:
git add .gitattributes

That’s it! You should then be able to safely add, commit and push!

git add file.psd
git commit -m "Add design file"
git push origin main

By default the large files will be kept on disk locally and not be pushed remotely i.e. only the pointers are pushed. You can push it to the endpoint (git lfs env to find the endpoint) e.g. github by using the following command.

git lfs push --all <remote e.g. origin>

If you are still having trouble feel free to comment however I don’t guarantee that I have the answer. Git lfs is best used with Bitbucket read more here: https://www.atlassian.com/git/tutorials/git-lfs