zscore can be used to basically answer by how much (in standard deviation) a value is more or less than the mean. For example if your mean is 5, standard deviation 2 then if you encounter a value with a zscore of 2 this means that the value is 2 standard deviations above the mean and could be for example 9 depending on your distribution.
You could then set a maximum to alert for all values which has a zscore of for example 2 or above. Below is a sample algorithm to compute zscore from a series of values.
var array = [];
// based on code to generate array with a spike based on https://softwareengineering.stackexchange.com/questions/274424/generate-random-numbers-with-certain-spikes
// which defines an exponential function
for(var i=1;i<=10;i++){
  array.push(1/(1.1 - i/10));
}
console.log(array);

var bucket = [];
var bucket_size = 10;
var zscores = [];
var means = [];
var stds = [];

for (value in array){
  if (bucket.length >= bucket_size)
    bucket.shift();
  bucket.push(array[value]);

  var mean = bucket.reduce((a, b) => a + b, 0) / bucket.length;
  means.push(mean);

  var standard_deviation =
      Math.sqrt(bucket.map(x => Math.pow(x - mean, 2))
                .reduce((a, b) => a + b) / bucket.length);

  var zscore = (array[value] - mean) / standard_deviation;
  zscores.push(zscore);

  stds.push(standard_deviation);

}
console.log(zscores);
Generating a series of events containing a spike
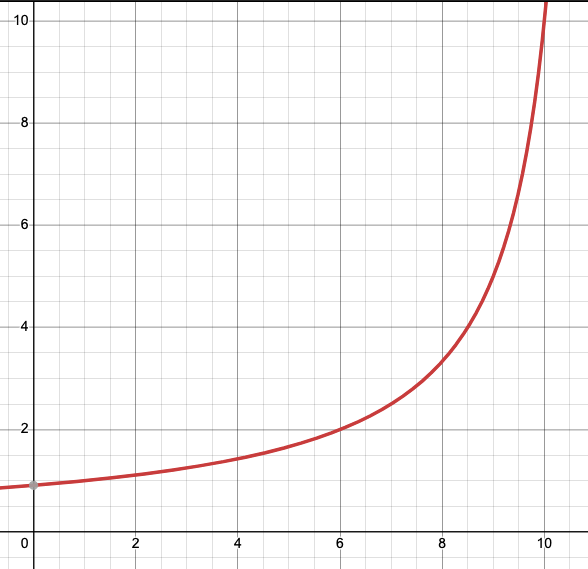
We have used an exponential algorithm inspired from stackoverflow: https://softwareengineering.stackexchange.com/questions/274424/generate-random-numbers-with-certain-spikes, see link in the code, to generate a series of events which will contain a spike at the end. You will notice when running the code that the zscore at the end is much more.
Bucketing the series to calculate zscore
We are bucketing the series into 10. In this case, the whole series length is 10 but we have added bucketing to help you handle bigger series. In a larger scenario you might run out of memory if you do all these calculations for the entire series in memory and also having a certain search window (defined by bucket size) can yield better results depending on your use case.
The code then just follows the regular zscore formula. The changes that you will need to do on your own is to go through the zscore and determine on which threshold you want to determine if a value is an anomaly.
This example outputs as follows:
0:
nan
1:
1.000000000000002
2:
1.2675004445952607
3:
1.4431464156799216
4:
1.5898283996891684
5:
1.7324006038049409
6:
1.8875705026381895
7:
2.073829320618413
8:
2.321061996113484
9:
2.688231708712125
So if we alert on a z-score of 2 this will alert us as from the 7th value which is a good detection of the spike.
If you want to learn about more algorithms like these ones I would suggest looking at this course on Coursera:
Inferential statistics are concerned with making inferences based on relations found in the sample, to relations in the population. Inferential statistics help us decide, for example, whether the differences between groups that we see in our data are strong enough to provide support for our hypothesis that group differences exist in general, in the entire population. We will start by considering the basic principles of significance testing: the sampling and test statistic distribution, p-value, significance level, power and type I and type II errors. Then we will consider a large number of statistical tests and techniques that help us make inferences for different types of data and different types of research designs. For each individual statistical test we will consider how it works, for what data and design it is appropriate and how results should be interpreted. You will also learn how to perform these tests using freely available software. For those who are already familiar with statistical testing: We will look at z-tests for 1 and 2 proportions, McNemar’s test for dependent proportions, t-tests for 1 mean (paired differences) and 2 means, the Chi-square test for independence, Fisher’s exact test, simple regression (linear and exponential) and multiple regression (linear and logistic), one way and factorial analysis of variance, and non-parametric tests (Wilcoxon, Kruskal-Wallis, sign test, signed-rank test, runs test).