This post covers how to plot JSON stats files generated by EventStoreDB 20.10.2 directly into the terminal. The pre-requisites are:
If you are short on time then the final command looks like the following:
cat log-stats.json | jq -r '.["@t"] + " " + (.stats.sys.cpu|tostring)' | gnuplot -p -e 'set xdata time; set timefmt "%Y-%m-%dT%H:%M:%.7SZ";set format x "%d %H:%M"; set term dumb 70 35; plot "/dev/stdin" using 1:2 with linespoints'EventStore stats contains a lot of metrics. What we want to plot is the @t field on the x-axis and a metric for example the system cpu usage on the y-axis.
This is a sample line from a random stats file of EventStoreDB. In EventStoreDB every line of the stats file is a valid JSON element. Bonus: This means that if ever you wanted to export the data to ElasticSearch you could just send that line to index it without any modification.
{
   "@t":"2021-07-10T12:40:03.1954998Z",
   "@mt":"{@stats}",
   "stats":{
      "proc":{
         "startTime":"2021-07-10T12:39:58.7025853Z",
         "id":15268,
         "mem":78970880,
         "cpu":-1,
         "threadsCount":-1,
         "contentionsRate":-1,
         "thrownExceptionsRate":-1,
         "gc":{
            "allocationSpeed":-1,
            "gen0ItemsCount":-1,
            "gen0Size":-1,
            "gen1ItemsCount":-1,
            "gen1Size":-1,
            "gen2ItemsCount":-1,
            "gen2Size":-1,
            "largeHeapSize":-1,
            "timeInGc":-1,
            "totalBytesInHeaps":-1048576
         },
         "diskIo":{
            "readBytes":1252269,
            "writtenBytes":37983,
            "readOps":488,
            "writeOps":1130
         },
         "tcp":{
            "connections":0,
            "receivingSpeed":0,
            "sendingSpeed":0,
            "inSend":0,
            "measureTime":"737980.12:40:03.1825929",
            "pendingReceived":0,
            "pendingSend":0,
            "receivedBytesSinceLastRun":0,
            "receivedBytesTotal":0,
            "sentBytesSinceLastRun":0,
            "sentBytesTotal":0
         }
      },
      "sys":{
         "cpu":0,
         "freeMem":8555593728,
         "drive":{
            "C":{
               "availableBytes":585366077440,
               "totalBytes":695771066368,
               "usage":"15%",
               "usedBytes":110404988928
            }
         }
      },
      "es":{
         "checksum":421,
         "checksumNonFlushed":421,
         "queue":{
            "Index Committer":{
               "queueName":"Index Committer",
               "groupName":"",
               "avgItemsPerSecond":0,
               "avgProcessingTime":20.6789,
               "currentIdleTime":"0:00:00:00.8203215",
               "currentItemProcessingTime":null,
               "idleTimePercent":98.01217837170631,
               "length":0,
               "lengthCurrentTryPeak":0,
               "lengthLifetimePeak":0,
               "totalItemsProcessed":1,
               "inProgressMessage":"<none>",
               "lastProcessedMessage":"CommitAck"
            },
            "MainQueue":{
               "queueName":"MainQueue",
               "groupName":"",
               "avgItemsPerSecond":41,
               "avgProcessingTime":1.8007140000000001,
               "currentIdleTime":"0:00:00:00.0019794",
               "currentItemProcessingTime":null,
               "idleTimePercent":92.46169560776302,
               "length":0,
               "lengthCurrentTryPeak":4,
               "lengthLifetimePeak":4,
               "totalItemsProcessed":50,
               "inProgressMessage":"<none>",
               "lastProcessedMessage":"Schedule"
            },
            "MonitoringQueue":{
               "queueName":"MonitoringQueue",
               "groupName":"",
               "avgItemsPerSecond":4,
               "avgProcessingTime":0.0972,
               "currentIdleTime":"0:00:00:00.8179220",
               "currentItemProcessingTime":null,
               "idleTimePercent":99.9542884369567,
               "length":0,
               "lengthCurrentTryPeak":0,
               "lengthLifetimePeak":0,
               "totalItemsProcessed":5,
               "inProgressMessage":"<none>",
               "lastProcessedMessage":"WriteEventsCompleted"
            },
            "PersistentSubscriptions":{
               "queueName":"PersistentSubscriptions",
               "groupName":"",
               "avgItemsPerSecond":4,
               "avgProcessingTime":1.0383,
               "currentIdleTime":"0:00:00:00.0020782",
               "currentItemProcessingTime":null,
               "idleTimePercent":99.4996254491069,
               "length":0,
               "lengthCurrentTryPeak":0,
               "lengthLifetimePeak":0,
               "totalItemsProcessed":5,
               "inProgressMessage":"<none>",
               "lastProcessedMessage":"PersistentSubscriptionTimerTick"
            },
            "Projection Core #0":{
               "queueName":"Projection Core #0",
               "groupName":"Projection Core",
               "avgItemsPerSecond":1,
               "avgProcessingTime":0.56005,
               "currentIdleTime":"0:00:00:01.0063733",
               "currentItemProcessingTime":null,
               "idleTimePercent":99.89183045270572,
               "length":0,
               "lengthCurrentTryPeak":0,
               "lengthLifetimePeak":0,
               "totalItemsProcessed":2,
               "inProgressMessage":"<none>",
               "lastProcessedMessage":"SubComponentStarted"
            },
            "Projections Leader":{
               "queueName":"Projections Leader",
               "groupName":"",
               "avgItemsPerSecond":9,
               "avgProcessingTime":0.46166,
               "currentIdleTime":"0:00:00:00.8931152",
               "currentItemProcessingTime":null,
               "idleTimePercent":99.55437527849736,
               "length":0,
               "lengthCurrentTryPeak":0,
               "lengthLifetimePeak":0,
               "totalItemsProcessed":10,
               "inProgressMessage":"<none>",
               "lastProcessedMessage":"EpochWritten"
            },
            "Storage Chaser":{
               "queueName":"Storage Chaser",
               "groupName":"",
               "avgItemsPerSecond":63,
               "avgProcessingTime":0.7814632352941177,
               "currentIdleTime":"0:00:00:00.0032413",
               "currentItemProcessingTime":null,
               "idleTimePercent":95.00599578181105,
               "length":0,
               "lengthCurrentTryPeak":0,
               "lengthLifetimePeak":0,
               "totalItemsProcessed":68,
               "inProgressMessage":"<none>",
               "lastProcessedMessage":"ChaserCheckpointFlush"
            },
            "StorageReaderQueue #1":{
               "queueName":"StorageReaderQueue #1",
               "groupName":"StorageReaderQueue",
               "avgItemsPerSecond":0,
               "avgProcessingTime":5.8326,
               "currentIdleTime":"0:00:00:01.0034104",
               "currentItemProcessingTime":null,
               "idleTimePercent":99.42209177905863,
               "length":0,
               "lengthCurrentTryPeak":0,
               "lengthLifetimePeak":0,
               "totalItemsProcessed":1,
               "inProgressMessage":"<none>",
               "lastProcessedMessage":"ReadStreamEventsBackward"
            },
            "StorageReaderQueue #2":{
               "queueName":"StorageReaderQueue #2",
               "groupName":"StorageReaderQueue",
               "avgItemsPerSecond":0,
               "avgProcessingTime":5.661,
               "currentIdleTime":"0:00:00:01.0033967",
               "currentItemProcessingTime":null,
               "idleTimePercent":99.43892257595347,
               "length":0,
               "lengthCurrentTryPeak":0,
               "lengthLifetimePeak":0,
               "totalItemsProcessed":1,
               "inProgressMessage":"<none>",
               "lastProcessedMessage":"ReadStreamEventsBackward"
            },
            "StorageReaderQueue #3":{
               "queueName":"StorageReaderQueue #3",
               "groupName":"StorageReaderQueue",
               "avgItemsPerSecond":0,
               "avgProcessingTime":5.6474,
               "currentIdleTime":"0:00:00:01.0034069",
               "currentItemProcessingTime":null,
               "idleTimePercent":99.44025868153523,
               "length":0,
               "lengthCurrentTryPeak":0,
               "lengthLifetimePeak":0,
               "totalItemsProcessed":1,
               "inProgressMessage":"<none>",
               "lastProcessedMessage":"ReadStreamEventsBackward"
            },
            "StorageReaderQueue #4":{
               "queueName":"StorageReaderQueue #4",
               "groupName":"StorageReaderQueue",
               "avgItemsPerSecond":0,
               "avgProcessingTime":0,
               "currentIdleTime":null,
               "currentItemProcessingTime":null,
               "idleTimePercent":100,
               "length":0,
               "lengthCurrentTryPeak":0,
               "lengthLifetimePeak":0,
               "totalItemsProcessed":0,
               "inProgressMessage":"<none>",
               "lastProcessedMessage":"<none>"
            },
            "StorageWriterQueue":{
               "queueName":"StorageWriterQueue",
               "groupName":"",
               "avgItemsPerSecond":4,
               "avgProcessingTime":24.53265,
               "currentIdleTime":"0:00:00:00.8697286",
               "currentItemProcessingTime":null,
               "idleTimePercent":88.15913918900499,
               "length":0,
               "lengthCurrentTryPeak":0,
               "lengthLifetimePeak":0,
               "totalItemsProcessed":6,
               "inProgressMessage":"<none>",
               "lastProcessedMessage":"WritePrepares"
            },
            "Subscriptions":{
               "queueName":"Subscriptions",
               "groupName":"",
               "avgItemsPerSecond":2,
               "avgProcessingTime":1.2562333333333333,
               "currentIdleTime":"0:00:00:00.0311524",
               "currentItemProcessingTime":null,
               "idleTimePercent":99.63733643093632,
               "length":0,
               "lengthCurrentTryPeak":0,
               "lengthLifetimePeak":0,
               "totalItemsProcessed":3,
               "inProgressMessage":"<none>",
               "lastProcessedMessage":"CheckPollTimeout"
            },
            "Timer":{
               "queueName":"Timer",
               "groupName":"",
               "avgItemsPerSecond":14,
               "avgProcessingTime":0.19026470588235295,
               "currentIdleTime":"0:00:00:00.0032505",
               "currentItemProcessingTime":null,
               "idleTimePercent":99.72829060690019,
               "length":5,
               "lengthCurrentTryPeak":8,
               "lengthLifetimePeak":8,
               "totalItemsProcessed":17,
               "inProgressMessage":"<none>",
               "lastProcessedMessage":"ExecuteScheduledTasks"
            },
            "Worker #1":{
               "queueName":"Worker #1",
               "groupName":"Workers",
               "avgItemsPerSecond":0,
               "avgProcessingTime":0,
               "currentIdleTime":null,
               "currentItemProcessingTime":null,
               "idleTimePercent":100,
               "length":0,
               "lengthCurrentTryPeak":0,
               "lengthLifetimePeak":0,
               "totalItemsProcessed":0,
               "inProgressMessage":"<none>",
               "lastProcessedMessage":"<none>"
            },
            "Worker #2":{
               "queueName":"Worker #2",
               "groupName":"Workers",
               "avgItemsPerSecond":0,
               "avgProcessingTime":0,
               "currentIdleTime":null,
               "currentItemProcessingTime":null,
               "idleTimePercent":100,
               "length":0,
               "lengthCurrentTryPeak":0,
               "lengthLifetimePeak":0,
               "totalItemsProcessed":0,
               "inProgressMessage":"<none>",
               "lastProcessedMessage":"<none>"
            },
            "Worker #3":{
               "queueName":"Worker #3",
               "groupName":"Workers",
               "avgItemsPerSecond":0,
               "avgProcessingTime":0,
               "currentIdleTime":null,
               "currentItemProcessingTime":null,
               "idleTimePercent":100,
               "length":0,
               "lengthCurrentTryPeak":0,
               "lengthLifetimePeak":0,
               "totalItemsProcessed":0,
               "inProgressMessage":"<none>",
               "lastProcessedMessage":"<none>"
            },
            "Worker #4":{
               "queueName":"Worker #4",
               "groupName":"Workers",
               "avgItemsPerSecond":0,
               "avgProcessingTime":0,
               "currentIdleTime":null,
               "currentItemProcessingTime":null,
               "idleTimePercent":100,
               "length":0,
               "lengthCurrentTryPeak":0,
               "lengthLifetimePeak":0,
               "totalItemsProcessed":0,
               "inProgressMessage":"<none>",
               "lastProcessedMessage":"<none>"
            },
            "Worker #5":{
               "queueName":"Worker #5",
               "groupName":"Workers",
               "avgItemsPerSecond":0,
               "avgProcessingTime":0,
               "currentIdleTime":null,
               "currentItemProcessingTime":null,
               "idleTimePercent":100,
               "length":0,
               "lengthCurrentTryPeak":0,
               "lengthLifetimePeak":0,
               "totalItemsProcessed":0,
               "inProgressMessage":"<none>",
               "lastProcessedMessage":"<none>"
            }
         },
         "writer":{
            "lastFlushSize":185,
            "lastFlushDelayMs":0.008,
            "meanFlushSize":185,
            "meanFlushDelayMs":0.008,
            "maxFlushSize":185,
            "maxFlushDelayMs":0.008,
            "queuedFlushMessages":0
         },
         "readIndex":{
            "cachedRecord":2,
            "notCachedRecord":0,
            "cachedStreamInfo":6,
            "notCachedStreamInfo":12,
            "cachedTransInfo":0,
            "notCachedTransInfo":0
         }
      },
      "timestamp":"2021-07-10T12:40:03.1929223Z"
   },
   "SourceContext":"REGULAR-STATS-LOGGER",
   "ProcessId":15268,
   "ThreadId":13
}
Selecting System CPU
Therefore, the first step in doing this is to select the right values. If we wanted to select the cpu stats of the system directly we could start with the following:
cat log-stats.json | jq '.stats.sys.cpu'The bar | means to pipe and this command will pipe everything from the Linux Concatenate command into jq and then with jq we are specifying a basic filter, the dot filter. From the dot filter we then specify starting from the highest element in the json file down to the lowest (if you think about it as a tree data structure) element which is a leaf element the cpu metric.
The above query will generate the something like the following output.
3.7089055
13.255805
9.790947
18.27493
9.216788
2.3326468
23.251188
33.470463
28.646309
25.539902
29.907745
28.43653
34.446194
36.302208
32.793518
30.899149
28.076542
36.76352
34.19705
29.917332
Selecting Time
Now let’s try to select the time field and try to concatenate the resulting time field with the system processor field. The time is easily selected alone with:
cat log-stats.json | jq '.["@t"]'We have to add the double quotes because of the @. In cases where the fields have spaces we would also have had to add the double quotes.
Combining Time & Processor Metrics
In jq you can combine outputs with the addition + operator. But if we try to just add them as follows:
cat log-stats.json | jq '.["@t"] + .stats.sys.cpu'We will get an error that we can’t add a string (time) with an integer (cpu):
jq: error (at :0): string (“2021-07-10…) and number (9.457963) cannot be added
Let’s convert cpu to a string and then add both of the strings together with a space in the middle. This is possible with jq using the tostring operator as follows:
cat log-stats.json | jq '.["@t"] + " " + (.stats.sys.cpu|tostring)'The output should then something as the following:
"2021-07-10T12:50:20.8773244Z 40.122253"
"2021-07-10T12:50:21.8840932Z 30.23657"
"2021-07-10T12:50:22.8923130Z 34.853474"
"2021-07-10T12:50:23.9067622Z 15.039631"
"2021-07-10T12:50:24.9231023Z 13.266266"
"2021-07-10T12:50:25.9354628Z 9.457963"
Removing Double Quotes
You will notice that there are double quotes around our output. We don’t want that because gnuplot will confuse the output to a single field. Removing the double is easy, we can provide jq with an additional parameter -r to provide raw output.
cat log-stats.json | jq -r '.["@t"] + " " + (.stats.sys.cpu|tostring)'Which will give us:
2021-07-10T12:50:20.8773244Z 40.122253
2021-07-10T12:50:21.8840932Z 30.23657
2021-07-10T12:50:22.8923130Z 34.853474
2021-07-10T12:50:23.9067622Z 15.039631
2021-07-10T12:50:24.9231023Z 13.266266
2021-07-10T12:50:25.9354628Z 9.457963
GNUPLOT
Our input is now ready to be processed by gnuplot. The tricky part here actually is to process the time field. In order to do that there a few commands that you need to provide gnuplot with regarding the time value.
- You need to tell gnuplot that the first column is a datetime format. You can do this with: set xdata time;
- Then you need to provide gnuplot with the exact time format of the data: set timefmt “%Y-%m-%dT%H:%M:%.7SZ”; You can read more about the time format in the official gnuplot docs: http://gnuplot.sourceforge.net/docs_4.2/node274.html
- Then you need to provide the format of the output in your x-axis: set format x “%d %H:%M”;
- We need to the tell gnuplot to output the graph in terminal: set term dumb 70 35; There are many other types of outputs possible like saving directly to a png on disk that you might want to look into.
- Finally we need to tell gnuplot to take the input from the standard input directly, then we need to tell gnuplot which fields to use and which of kind plot to draw: plot “/dev/stdin” using 1:2 with linespoints
Combining the whole gnuplot and jq commands will look as follows:
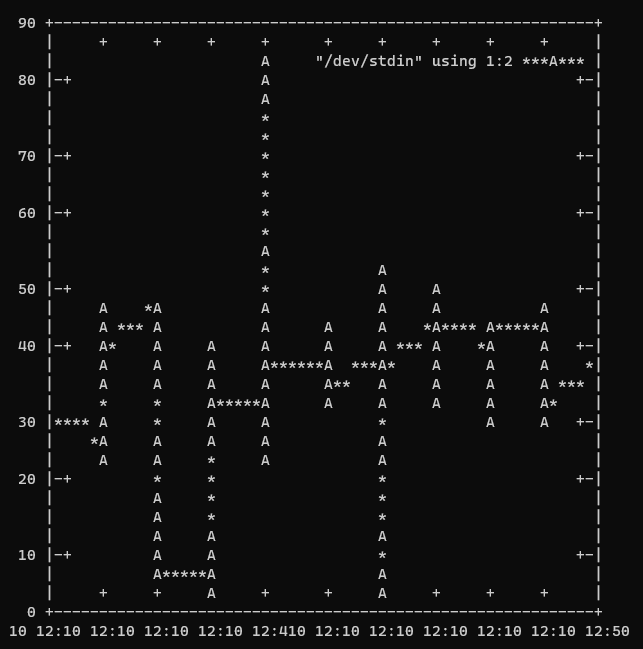
cat log-stats.json | jq -r '.["@t"] + " " + (.stats.sys.cpu|tostring)' | gnuplot -p -e 'set xdata time; set timefmt "%Y-%m-%dT%H:%M:%.7SZ";set format x "%d %H:%M"; set term dumb 70 35; plot "/dev/stdin" using 1:2 with linespoints'This command will generate the graph in the terminal. For example the screenshot below is on a Ubuntu 20.04 WSL 2.0 terminal on Windows.
We hope that this was useful, please comment if you are stuck or want another guide!

One reply on “Plot JSON Stats For EventStoreDB Terminal Edition”
Awesome blog post on jq and gnuplot! Need more tutorial like this one. 🙂