I have recently stumbled upon MindsDB on Product Hunt. The way it works is by first connecting to a data source, creating a machine learning model, training and then running a prediction. All this is done in a SQL-like query.
So I decided to add one more database integration, my favourite and the best state transition database, EventStoreDB. At the moment my Pull Request is still in review at https://github.com/mindsdb/mindsdb/pull/5579 (update: it’s merged!).
What this means is that you will need to checkout that branch and build it locally if you would like to use the EventStoreDB integration. Thankfully, this is not hard to do.
How to build MindsDB locally for development?
In a few steps:
- Make sure you are using Python 3.9
- Checkout the branch that you want locally
- Go to the folder create a virtual env (python -m venv .)
- Activate the environment, for example: on Linux: source <venv>/bin/activate or on Windows C:\> <venv>\Scripts\activate.bat
- python setup.py develop
- python -m mindsdb (A web UI should pop up)
- Or you can open it in PyCharm (configure it to use the same interpreter and venv). You can be able to just run it.
How to use the EventStoreDB Integration?
Access the Web UI at http://127.0.0.1:47334/editor if it has not yet opened.
Before creating a connection, you should make sure your EventStoreDB is running with EnableAtomPubOverHTTP=True, RunProjections=All and to enable the $streams projection. This is required to allow MindsDB to get all the available tables i.e. streams. Make sure that $streams stream has at least one available stream.
The integration treats EventStoreDB streams as tables and every JSON Event’s data key as column. Events with nested JSON are flattened with underscore as the separator.
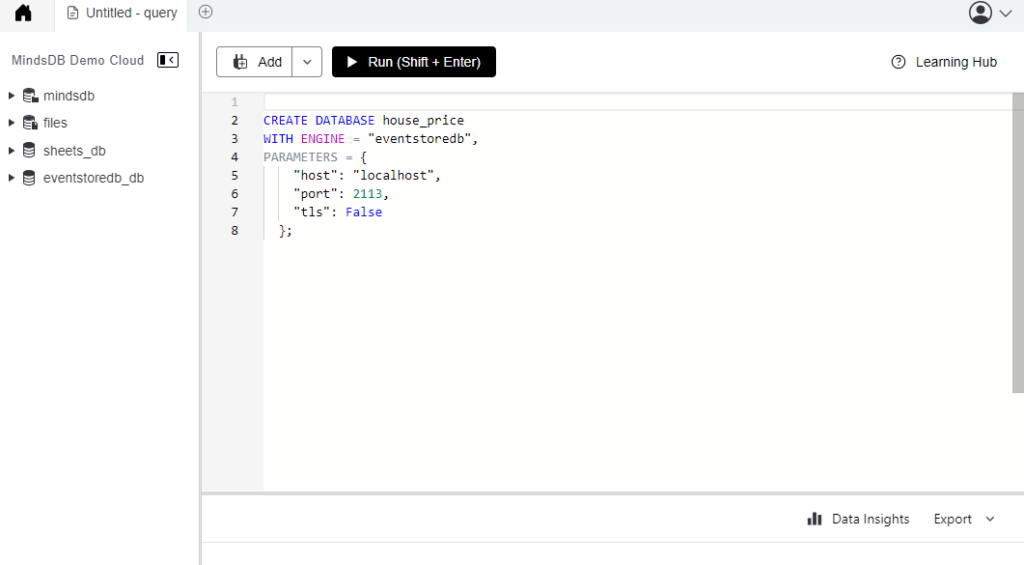
Once you have done that, you can run a query to create a connection to your EventStoreDB. You could use the following for an insecure ESDB node.
CREATE DATABASE house_price
WITH ENGINE = "eventstoredb",
PARAMETERS = {
    "host": "localhost",
    "port": 2113,
    "tls": False
  };
Or if you would like to connect to a secure node
CREATE DATABASE house_price
WITH ENGINE = "eventstoredb",
PARAMETERS = {
"user": "admin",
"password": "changeit",
"tls": True,
"host":"localhost",
"port":2113
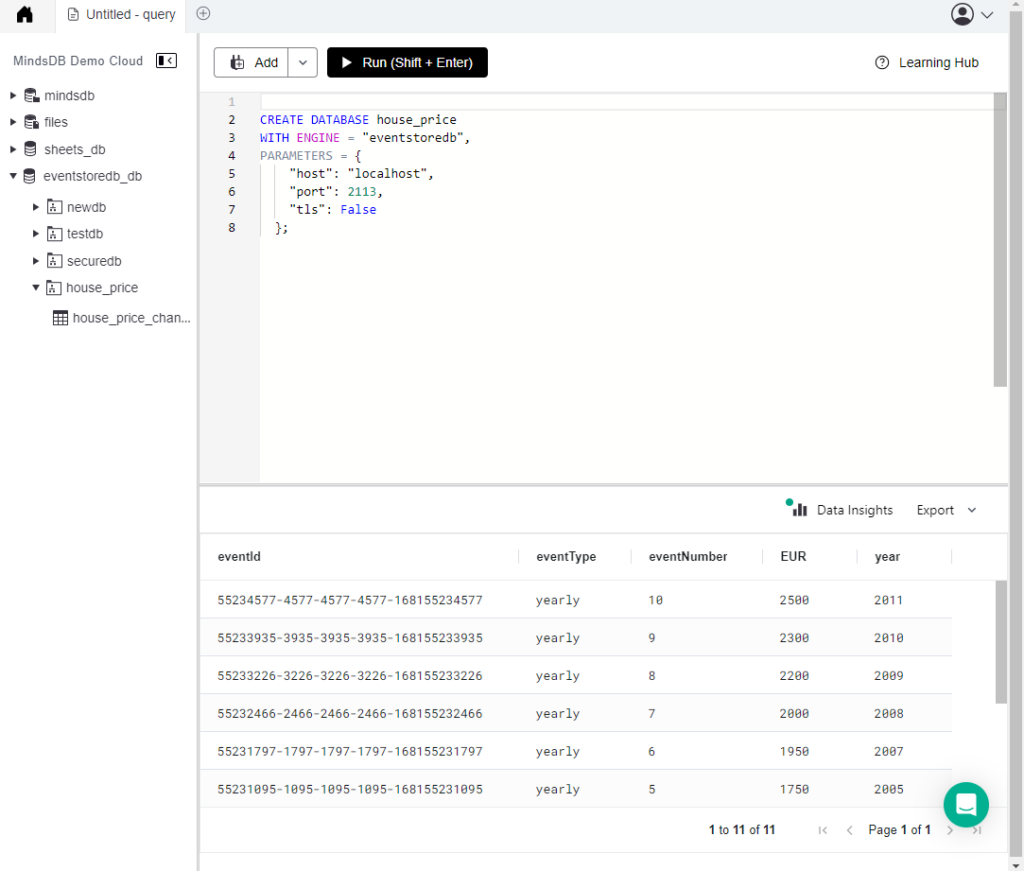
};If this is successful you should then see on the left a drop down to display all the tables (streams).
How to run Machine Learning on your EventStoreDB data?
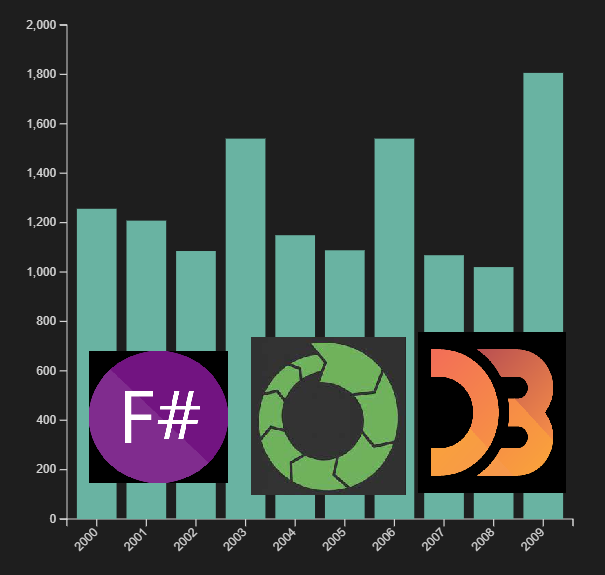
Now that we have access to EventStoreDB’s data, we can create a model and train it on that data. For the sake of this example we will use a stream named house_price_changes and events with the following data format:
{
"EUR": int,
"year": int
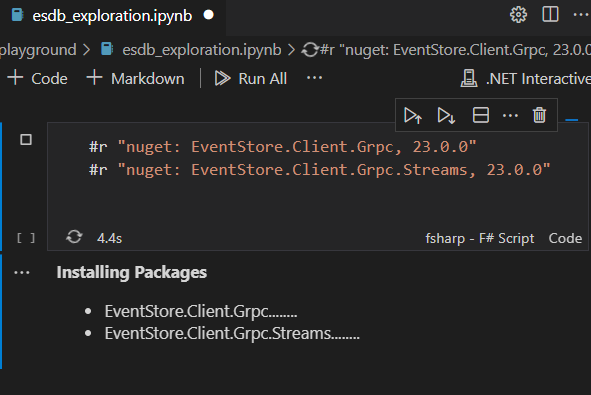
}Add a few dummy data, if you are having trouble doing that you can follow this article: Using F# and EventStoreDB’s gRPC client is easy
Once you have at least 10 events, you can then create a model.
You should be able to see it in your MindsDB editor as follows:
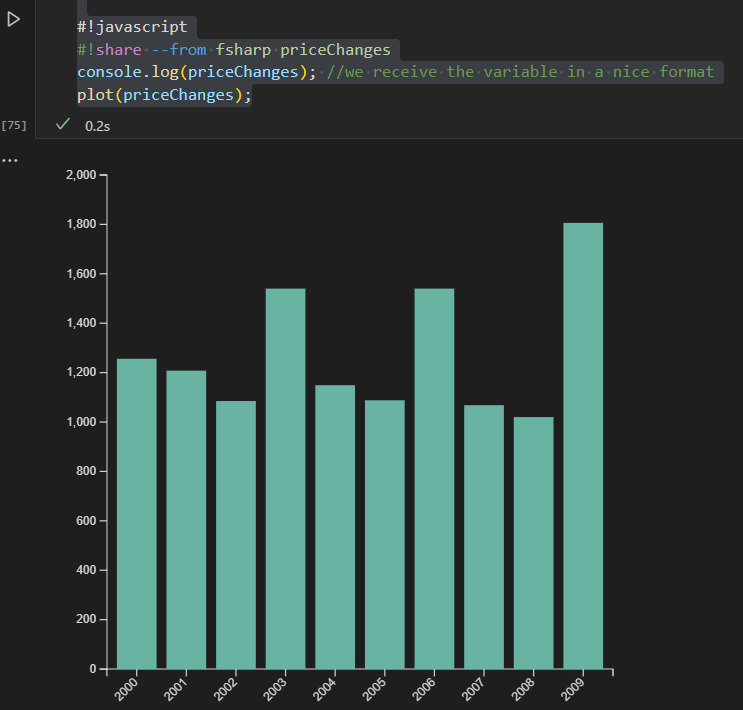
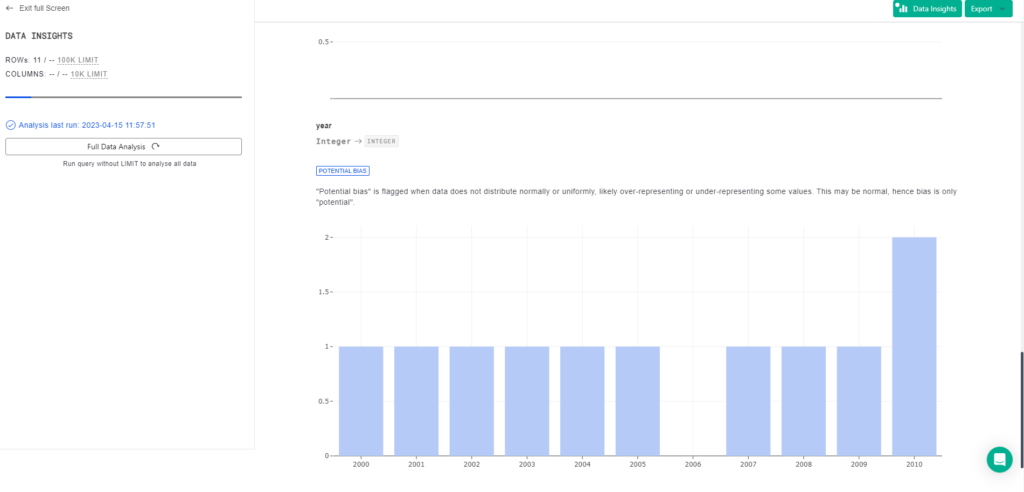
You can get a quick statistical analysis on your data by clicking on the data insights button.
For example this shows that we have a gap in your data and that we are missing data for the year 2006.
Creating a simple ML model in MindsDB
The simplest model is to just do regression on the data and to predict the EUR field based on the year field.
CREATE MODEL mindsdb.home_price_model
FROM house_price
  (SELECT * FROM house_price.home_price_model)
PREDICT EUR
USING engine = 'lightwood',
      tag = 'house price model';
This will cause MindsDB to start training the model. This can take a while so if you would like to check the status of the training you can run a select command on the model name. For example:
SELECT *
FROM mindsdb.models
WHERE name='home_price_model';
Or you can click on the drop down on the left showing all models.
Making prediction with MindsDB
Once training is successful, you can start making predictions. You do that by making a SELECT query against the model you just created. For example:
SELECT EUR
FROM mindsdb.home_price_model
WHERE year=2023;
Here we are using the data that we have (2000 to 2010) available to predict the price of a house in the year 2023. This will produce a result in EUR (your prediction).
This is the simplest version of Machine Learning. There are more interesting(and complicated) things that can you run and predict at https://docs.mindsdb.com/ml-types
Have fun! 😀