In this post we look into:
- Connecting to ESDB
- Writing events
- Reading the events
- Deserializing the events
- Sharing the events with Javascript code
- Visualizing the events with d3js.
You can check the code at: https://gist.github.com/Lougarou/7da6e3b69ea803b263037b1b7a86ab81
How to create a Polyglot Notebook project in VS Code
Step 1: Install Visual Studio Code
Step 2: Install the extension and .NET 7 SDK https://marketplace.visualstudio.com/items?itemName=ms-dotnettools.dotnet-interactive-vscode
Step 3: From Visual Studio code: Click Help->Show All Commands->Polyglot Notebook create default notebook as shown below:
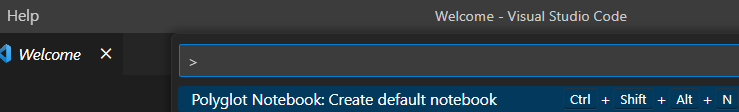
Then choose Choose .ipyb and then F#.
You are now ready to write interactive code in multiple languages as we will see further. By the way Visual Studio Code has likely installed .NET interactive in background.
How to specify different languages in Polyglot Notebooks
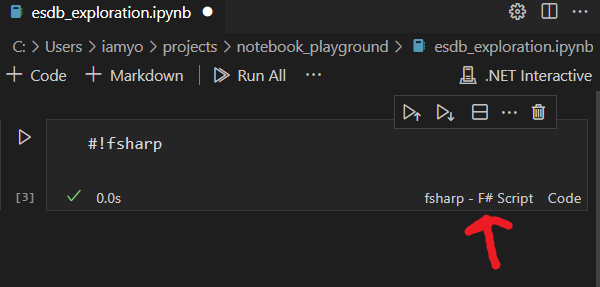
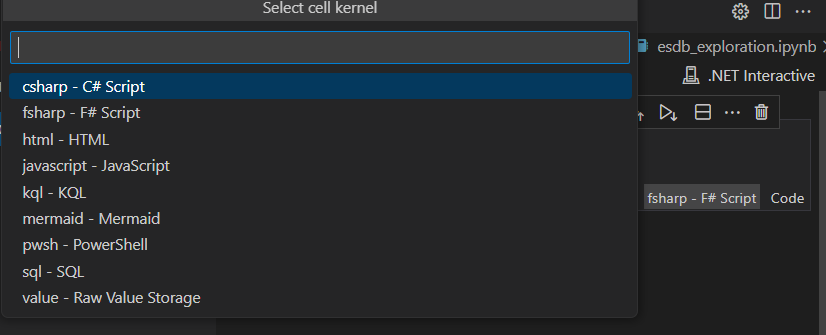
You can either write #!fsharp at the start of the cell or you can click and choose bottom right as show in the screenshot. Upon clicking on it you will find all the Notebook Kernels available to run your cells.
For example:
How do you install NuGet Libraries in Polyglot Notebooks?
Next we need to import our EventStore gRPC Client libaries like we did in Using F# and EventStoreDB’s gRPC client is easy
To do that we need to add a special #r and then details about our NuGet package. So for us the following:
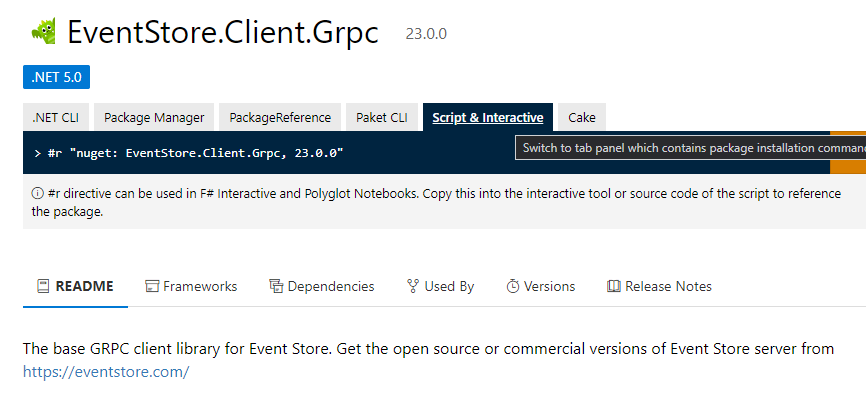
#r "nuget: EventStore.Client.Grpc, 23.0.0"
#r "nuget: EventStore.Client.Grpc.Streams, 23.0.0"
If you are not sure what to write, the web page of the NuGet package will help you. Click on the Script & Interactive tab:
If you then click on the Play button of the cell you will see that VS Code will try to install the packages:
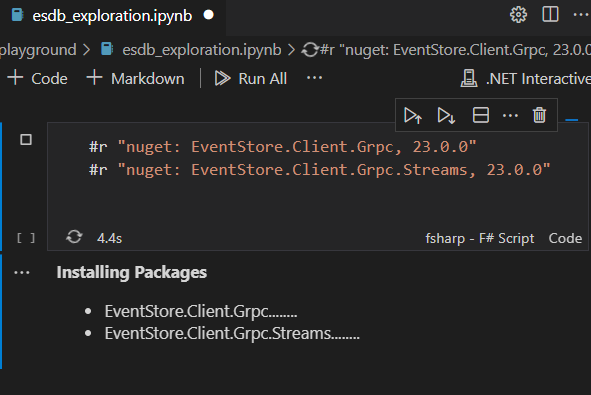
Once this is done, click the +Code button to create a new cell.
Write Events To ESDB with FSharp
Let’s start by writing events. We already covered that in Using F# and EventStoreDB’s gRPC client is easy. We need to create a list of events and send them to ESDB. We can do that as follows:
open EventStore.Client
open System.Collections.Generic

let client = EventStoreClientSettings.Create "esdb://127.0.0.1:2113?tls=false"
             |> EventStoreClient

let streamName = "house_price_changes"
let eventsList = List.init 10 (fun index ->
    EventData(
        Uuid.NewUuid(),
        "rent",
        ReadOnlyMemory<byte>(Encoding.UTF8.GetBytes("{\"USD\":"+ string(Random().Next(1000,2000))+", \"year\":"+string(2000+index)+"}"))
        )
    )
client.AppendToStreamAsync(streamName, StreamState.Any, eventsList).Wait() //assuming stream doesn't exist
We are creating JSON events, you can use System.Text.Json to serialize types if you want. Later we will cover how to Deserialize your JSON events in FSharp.
Adding D3.js code
Create a new cell, this time put the kernel as Javascript or add #!javascript at the start. In the code, we will create a bar plot. You can do more complex visualizations but the underlying principles are the same.
configuredRequire = (require.config({
    paths: {
        d3: 'https://cdn.jsdelivr.net/npm/[email protected]/dist/d3.min'
    },
}) || require);

var caller = null;
//from: https://github.com/dotnet/interactive/blob/main/docs/javascript-overview.md
plot = function (data) {
    configuredRequire(['d3'], d3 => {
        // Call d3 here.
        //from: https://d3-graph-gallery.com/graph/barplot_basic.html
        const margin = {top: 30, right: 30, bottom: 70, left: 60},
        width = 512 - margin.left - margin.right,
        height = 512 - margin.top - margin.bottom;

        // append the svg object to the body of the page
        const svg = d3.select("#my_dataviz")
        .append("svg")
            .attr("width", width + margin.left + margin.right)
            .attr("height", height + margin.top + margin.bottom)
        .append("g")
            .attr("transform", `translate(${margin.left},${margin.top})`);

        // X axis
        const x = d3.scaleBand()
        .range([ 0, width ])
        .domain(data.map(function(d) { return d.year; }).reverse()) //because I was reading backwards
        .padding(0.2);

        svg.append("g")
        .attr("transform", `translate(0, ${height})`)
        .call(d3.axisBottom(x))
        .selectAll("text")
            .attr("transform", "translate(-10,0)rotate(-45)")
            .style("text-anchor", "end");

        // Add Y axis
        const y = d3.scaleLinear()
        .domain([0, 2000])
        .range([ height, 0]);
        svg.append("g")
        .call(d3.axisLeft(y));


        svg.selectAll("mybar")
        .data(data)
        .join("rect")
        .attr("x", function(d) { return x(d.year); })
        .attr("y", function(d) { return y(d.USD); })
        .attr("width", x.bandwidth())
        .attr("height", function(d) { return height - y(d.USD); })
        .attr("fill", "#69b3a2")
    });
}
Here we have imported d3.js from an external source, we are using the year as x-axis and USD as y-axis. We have mapped our domains based on the values in our data to the different positions on the x-axis and height of rectangles (our ranges). D3.js is mainly about mapping data to domains to ranges to shapes in SVG.
Note: If you want to add transitions you can check examples here: https://github.com/dotnet/interactive/tree/main/samples/notebooks/polyglot At the time of writing “true” streaming is not supported, you have to use js intervals and call d3 to update your graphs if you want them to change live with data connected with ESDB.
Reading our data and Deserializing JSON to a FSharp type
open System.Collections.Generic
open FSharp.Control
open System.Text.Json //to deserialize JSON event data to house_price_change type

type house_price_change = { USD : int ; year : int }
let eventToPair (resolvedEvent: ResolvedEvent) = //convert resolved event json data to house_price_change
    let JSONEventString = Encoding.UTF8.GetString(resolvedEvent.OriginalEvent.Data.ToArray())
    JsonSerializer.Deserialize<house_price_change> JSONEventString

let priceChanges  = List<house_price_change>() //we will append data that is read from ESDB and share this list with Javascript

client.ReadStreamAsync(Direction.Backwards,
                       "house_price_changes",
                       StreamPosition.End,
                       10L,
                       true)
    |> TaskSeq.iter (fun event -> (priceChanges.Add (eventToPair <| event)))
    |> Async.AwaitTask
    |> Async.RunSynchronously
Here we create a type house_price_change type house_price_change = { USD : int ; year : int } and we use System.Text.Json to deserialize our event’s JSON data to that type. This happens in our handler in ReadStreamAsync when we call our eventToPair function. In retrospect this would have better been called eventToHousePriceChanges 😅
We could have also used the serialize function to do the reverse when we were appending events.
Anyway, everyone is an expert in retrospect!
Sharing our variable to Javascript and plotting our data
#!html
<div id="my_dataviz"></div>
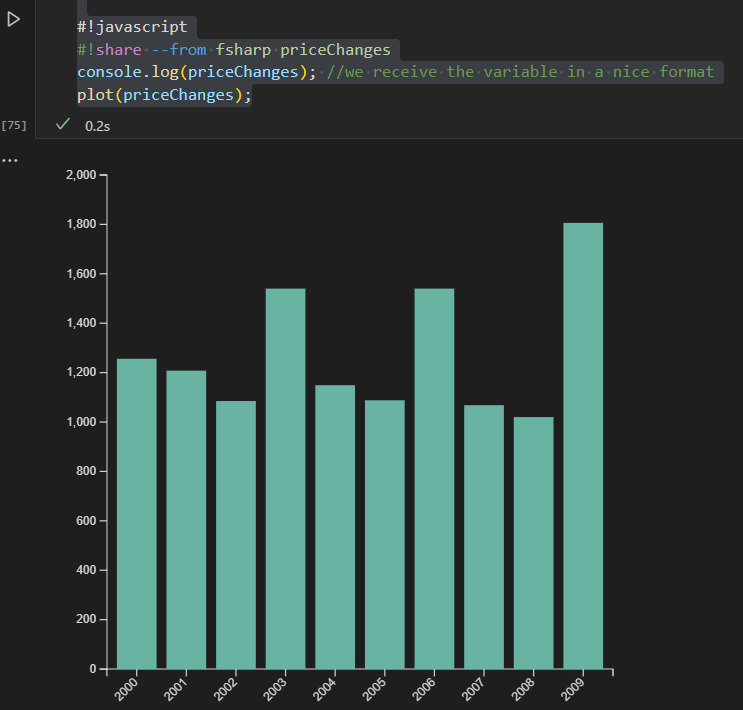
#!javascript
#!share --from fsharp priceChanges
console.log(priceChanges); //we receive the variable in a nice format
plot(priceChanges);Finally, we create a cell with first html code to create a div which will hold our graph. Then we tell the cell to start handling javascript code with #!javascript.
More interesting here, we tell the cell take our priceChanges variables which is a list holding a specific type. This works surprisingly well as you will see from the console output:
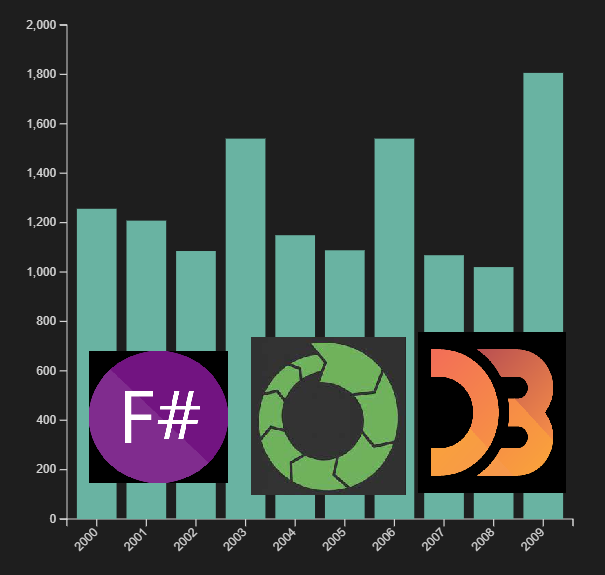
[{"USD":1806,"year":2009},{"USD":1020,"year":2008},{"USD":1068,"year":2007},{"USD":1540,"year":2006},{"USD":1088,"year":2005},{"USD":1149,"year":2004},{"USD":1540,"year":2003},{"USD":1085,"year":2002},{"USD":1208,"year":2001},{"USD":1256,"year":2000}]Then we pass that variable to out plot function defined before which will plot our price changes. This should generate a graph like the one below:
That’s it, you can continue to build on top of this. If you add other kernels like Python you could add even add machine learning to your notebooks (have not tried).
If you are confused about any part of this post please feel free to comment!